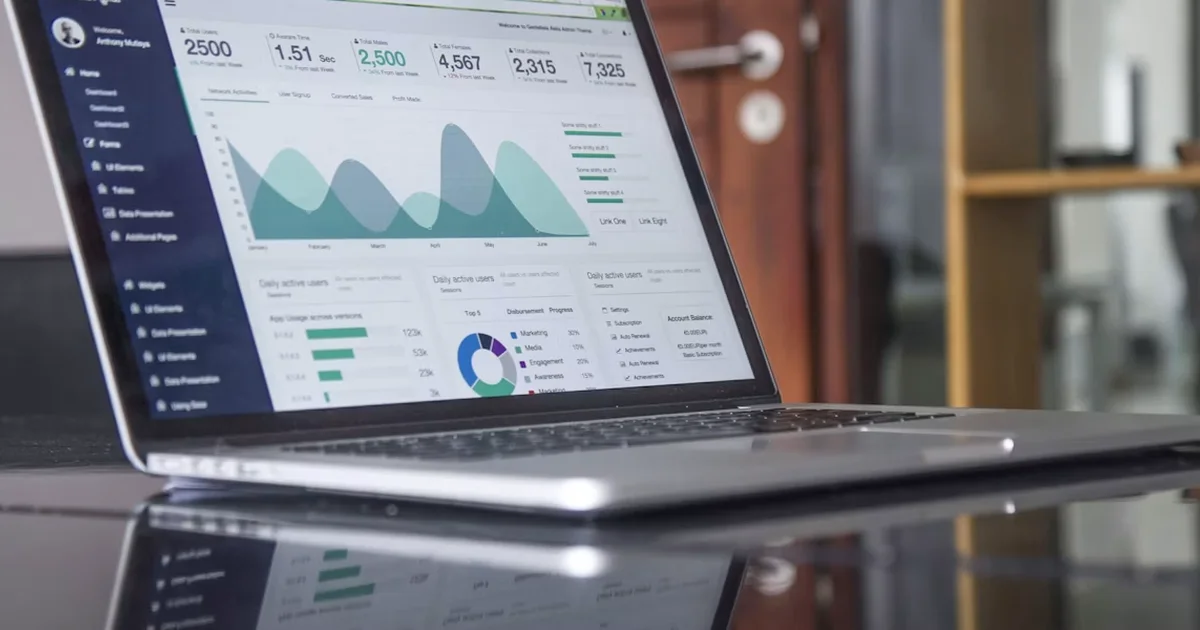
The short answerChoose a marketing analytics and reporting service that joins your ad, email, social and website data to the customer and sales records in your CRM, so management sees in one report which campaigns bring in paying customers, without the marketing team spending days stitching spreadsheets together.
The short answer
Choose a marketing analytics and reporting service that joins your ad, email, social and website data to the customer and sales records in your CRM, so management sees in one report which campaigns bring in paying customers, without the marketing team spending days stitching spreadsheets together.
What data analytics service can combine campaign and customer information into reports for management? A marketing analytics and reporting service that joins your ad, email, social and website data to the customer and sales records in your CRM, so management sees in one report which campaigns bring in paying customers. Nobody on the marketing team spends days stitching spreadsheets together to get there.
Judge any service on three things: can each figure be traced back to its source, does every KPI have an agreed definition, and does the report answer the decisions your managers actually make? Smart AI Solutions sets this up for you and stays with you after launch.
Disclosure: Smart AI Solutions wrote this guide and sells the reporting and CRM services linked in it.
Two neighbouring questions already have their own guides, so they are not repeated here. Building a recurring report from several data sources in general, with data-quality rules and review steps, is covered in our guide to recurring business reporting from multiple sources. Designing a KPI dashboard is covered in our KPI dashboard guide. This guide is about one join: marketing campaign data on one side, customer and sales data on the other.
Key takeaways
Six answers settle most of the decision.
| Question | Practical answer |
|---|---|
| What should the report connect? | Campaign activity from your ads and emails, social posts and website, joined to leads, sales and customer revenue in the CRM. |
| How are campaigns matched to customers? | Through campaign IDs, consistent UTM tracking and CRM lead or customer IDs that the business is permitted to use. Unmatched activity is reported as unmatched. |
| Which attribution model is right? | The one that answers your question. Pick it deliberately, apply it to every campaign and label the results as estimates. |
| What does management need on one page? | Spend, leads, paying customers and revenue by campaign, with the period, refresh time and attribution rule beside the figures. |
| Is automated collection enough? | No. Connectors still need checks against the source platforms. |
| Where do we start? | Our Data Analytics & Reporting service investigates your KPIs, builds the data pipelines and dashboards, and sets up scheduled reports. |
What a combined campaign and customer report gives management
Put campaign and customer data in one view and management can stop guessing which campaigns are worth the money. A channel report on its own shows clicks, impressions and opens. It can't show whether that activity became a qualified lead, a sale or repeat business, because those outcomes live in the CRM and the sales system.
A customer relationship management (CRM) system stores customer interactions, such as enquiries and sales follow-ups. Marketing analytics joins campaign activity to those customer and business outcomes. A dashboard then presents selected measures in a form people can review and explore.

Map each measure in the report to the system that supplies it, then check that the combined view keeps the detail managers need. A typical set looks like this:
| Source | What it contributes | What it cannot tell you alone |
|---|---|---|
| Ad platforms (Google, Meta, LinkedIn) | Spend, impressions, clicks, campaign and ad IDs | Whether a click became a customer |
| Email and social tools | Sends, opens, clicks, link tags | Which recipients later bought |
| Website analytics | Sessions, form fills, UTM parameters | Who the visitor was, until they identify themselves |
| CRM | Leads, contacts, deal stages, lead source | How much each campaign cost |
| Sales or accounting system | Invoices, revenue, refunds, repeat purchases | Which campaign started the relationship |
Customer segments, such as first-time and repeat customers, help managers compare results across groups. A difference between segments describes what happened. It does not prove that a campaign caused it. For segmentation at scale, our customer segmentation system for telecommunications shows how groups are built and compared.
Physical stores can add their own view. Foot Traffic & Layout Analytics uses anonymised camera data to analyse in-store movement, find underperforming departments and show where customers linger, so retailers can see how a layout change affects sales next to their campaign results.
Match campaign activity to customer records without guessing
Managers trust the report when every match between a campaign and a customer can be explained. Three fields do most of the work: campaign IDs from the ad platforms, consistent UTM parameters on every link, and the CRM's lead or customer ID. With those in place you can follow a customer from the first click to the invoice without leaning on a channel summary.
- UTM tracking needs one naming convention. Agree how the source and medium tags are written, and the campaign name too, in lower case, before the next campaign launches. "Facebook", "facebook" and "fb" otherwise become three channels in the report.
- Anonymous activity stays anonymous. Keep anonymous website activity separate until a permitted identifier links it to a known record. If no identifier exists, report the interaction as unattributed rather than assigning it to a customer or campaign by assumption.
- Duplicates and devices need written rules. Inconsistent rules for duplicate records and people who switch devices can inflate reported reach or credit a sale to the wrong campaign. Your team should be able to explain how any merged record was created.
- Offline sales count. Phone enquiries, walk-ins and deals closed by the sales team can finish a sale that began online. Include them when they can be linked reliably to a campaign or lead reference, or management sees only part of the result.
Getting enquiries into the CRM with their campaign details attached is the first step. If that is where your leads get lost today, start with our guide to automating lead capture and follow-up or our guide to website-to-CRM lead follow-up.

The flow from campaign and customer data inputs to a management report: capture, integrate, analyse, report.
Agree on attribution before comparing campaigns
Campaign comparisons only mean something once everyone counts the same way. Define each KPI before blending data, including how it is calculated, the reporting period and its source. Otherwise one team counts an enquiry as a conversion while another counts only a qualified lead or a completed sale.
Pair delivery measures, such as impressions and clicks, with business outcomes such as qualified leads, sales, revenue, cost per acquisition and retention. Clicks then stop passing for value, and managers have something firmer to judge marketing ROI on.
| Attribution approach | How it assigns credit | Question it helps answer |
|---|---|---|
| First-touch | Credits the first recorded interaction | Which campaign introduced the customer? |
| Last-touch | Credits the final recorded interaction | Which campaign came just before the sale? |
| Multi-touch | Shares credit across selected interactions | How should credit be split across the whole path to a sale? |
Each model answers a different question, so pick one on purpose. Apply the same rule to every campaign you compare, and label attributed conversions as estimates.
Management distinction: Attribution describes how a model shares out credit for a sale. It does not show that the campaign caused the sale. A controlled holdout, where a comparable group does not see the campaign, is the way to test whether a campaign produced customers who would not otherwise have bought.
Put what management needs on one page
A manager should get the headline at a glance and still be able to find the detail behind it. Start with spend, leads, paying customers and revenue, alongside the agreed efficiency or retention measures. Then add drill-downs by campaign or channel, and by customer segment, so a surprising result can be investigated without losing the summary.
- Context beside the figures. Show the reporting period, refresh time, KPI definitions and attribution rule next to the numbers. Readers then know what they are comparing, and a platform that reports a different total causes less confusion.
- A path to the source. Give each headline measure a route to its campaign and the underlying records, so a discrepancy can be traced to a definition, a data issue or a difference in scope.
- Scheduled reports and dashboards, each for its job. Use scheduled reports for the monthly marketing review and a marketing dashboard for exploring between reviews. Rebuilding the same figures by hand in spreadsheets brings in stale data and avoidable errors.
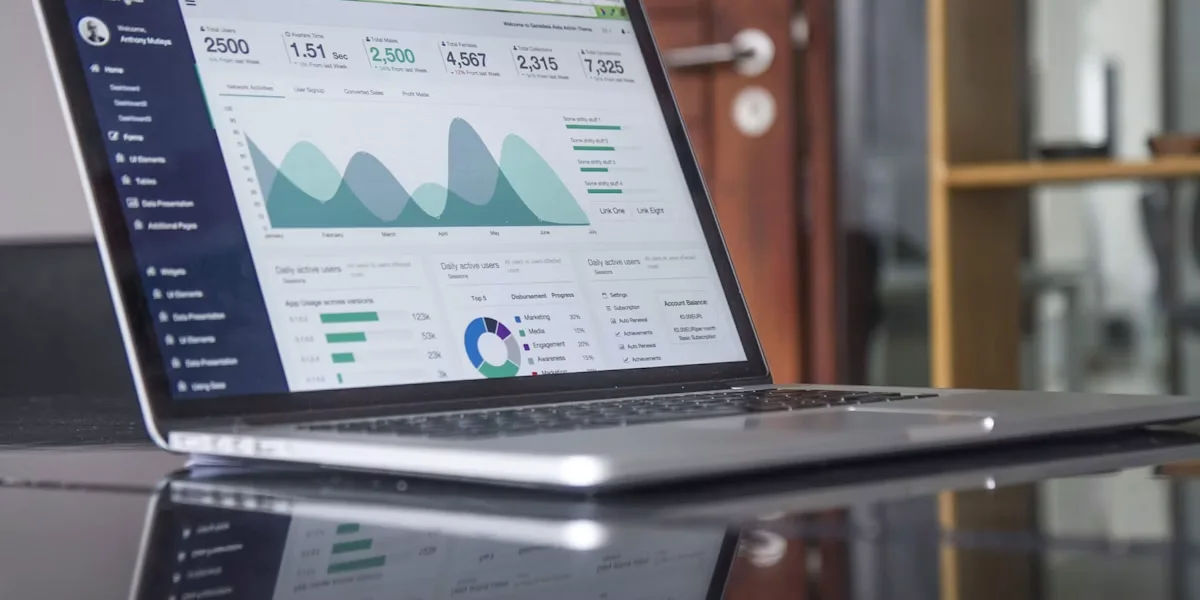
Campaign data can also show how customers respond, as well as whether they buy. Our article on how AI sentiment analysis changes outreach campaigns covers reading replies and comments at scale.
Check the data connections before automating the report
A connector is only useful if it carries the campaign, customer and outcome fields the report needs. Judge connectors by the fields and level of detail they deliver, not by how many of them a vendor lists.
A dedicated data pipeline makes sense when the report needs reshaped data, identity matching, data from several systems or a consistent history beyond what a simple connector supports. The pipeline should keep the definitions and processing rules that make each refresh comparable with the last.
Standardise campaign names, time zones, date ranges and metric definitions before blending the data. Otherwise one campaign splits across inconsistent names, or totals from different periods get compared. Automated collection still won't guarantee an accurate report: reconcile the combined totals with the platform figures and record the expected differences. The full data-quality routine for recurring reports is in our recurring reporting guide.
Protect customer information in combined reports
Joining marketing and customer data is only worth doing if customers' information stays protected. Use customer information only for purposes covered by the consent and permissions you hold under POPIA, and document how matching and profiling work, so the team can explain why data was joined and how each segment is used.
- Give staff access that matches their role. Executive summaries show aggregated results; customer-level detail goes only to the people who need it for their work.
- Keep identifiable fields out of routine reports unless they serve a defined purpose.
- Apply safeguards to small segments and exports, so a report cannot expose an individual through a group with very few members.
How to choose a marketing analytics service
Look for a service that takes the whole reporting job off your team. For recurring management reports that need KPI investigation and automated pipelines feeding dashboards and scheduled outputs, one service covering the full workflow cuts the hand-offs between data preparation, measurement and delivery. Ask each provider:
- Can you get the fields we need from our ad platforms, email tool, website analytics and CRM, at the level of detail our KPIs depend on?
- How will you match campaign activity to customer records, and how will unmatched activity show up in the report?
- Which attribution model do you recommend for our question, and will the report say which one it uses?
- How often will each source refresh, and how will we see when a source is late?
- How will the report reconcile with what Google, Meta or our email tool show, and who explains the differences?
- Who maintains the definitions, checks results and fixes broken connections after launch?
Those answers matter more than a long integration list. Weigh the ongoing effort to keep definitions current and resolve discrepancies alongside the initial work to connect the systems. For data analysts, the best reporting platform also depends on the existing stack and the way the team investigates results.
How we set it up with you
We do the setup and stay with you, so your marketing team keeps using the ad platforms, email tool and CRM it already knows. A common worry is that a report will put a wrong number in front of the board, or that a campaign will be cut on the strength of a figure nobody checked. So the rollout moves in three stages, and you set the pace:
- Everything is drafted and you approve it. The first reports arrive as drafts with their sources shown, and nothing reaches your board, partners or customers without your approval.
- Routine reports run on their own while you stay informed. Once the figures have matched the source platforms for a few cycles, the monthly campaign report goes out on schedule, with a short note on anything unusual.
- Hands-off, only when you choose. Some teams keep a review step for good. That's fine.
Setup is done for you: we investigate which KPIs matter, map them to the source data, build the pipelines and dashboards, and set up the scheduled reports. You see a first real result within 48 hours of go-live, and a named person checks in during the first weeks and answers quickly. Our Johannesburg reporting overview covers real-time dashboards and automated reporting for Johannesburg businesses.
The Data Analytics & Reporting service starts from R40,000 per project. If campaign details are not yet captured in a CRM, CRM and sales automation starts from R15,000 once-off setup, and the CRM Lite package adds an R2,999 per month SLA. See the pricing overview for the rest.
Frequently asked questions
Questions that come up when management wants campaign and customer data in one report.
How should a report handle refunds, cancellations or reversed sales?
Show gross conversions and revenue separately from net results after refunds, cancellations or reversals. Set a restatement window so managers know when a past period may still change as transactions are finalised.
How often should a campaign dashboard refresh?
As often as managers need to act and as each source can supply complete records. Show a freshness indicator for each dataset, so users can tell a current view from one still waiting on a source update.
Can campaign reporting include phone, in-store or other offline conversions?
Yes, when teams record them in a consistent format. Capture the conversion date, outcome and value, plus a campaign or lead reference where available, so the result can be read alongside online activity.
What should managers do when a source platform and the combined report show different totals?
Keep a reconciliation log that records the metric, period, figures and explanation for each material difference. When the totals cover different scopes, keep both with clear labels instead of forcing them into one number.
Can one reporting setup serve both executive summaries and detailed campaign analysis?
Yes. One shared reporting model can feed a concise default view for leadership and a more detailed analyst view, with controlled access to the fields needed for investigation.
What CRM technology compiles customer information from several sources and segments it for marketing campaigns?
A customer data platform (CDP) collects and unifies customer information from multiple sources into customer profiles, then segments those profiles for marketing campaigns. Some CRM systems also offer data integration and segmentation features.
Conclusion
The goal is one report where management sees which campaigns brought in paying customers, without the marketing team spending days on spreadsheets to produce it. So what data analytics service can combine campaign and customer information into reports for management? A reporting service that connects marketing, CRM, website and sales data, with clear matching rules, agreed KPIs and figures you can trace back to their source.
Choose the workflow that helps managers understand business outcomes, investigate the underlying records and protect customer information.
Start with one problem: a monthly report that shows spend, leads and paying customers for each campaign, through our Data Analytics & Reporting service. Once that report is trusted, add lead capture that tags every enquiry with its campaign through CRM and sales automation. If you are unsure where to begin, an AI readiness assessment sets the order.