The short answerYes. The sales, orders, stock and job records you already keep can show which weeks will be busy and where work keeps getting stuck. Start with one decision, tidy the history and test each forecast against a simple baseline, and you run out less, overstock less and stop rebuilding the same planning spreadsheet.
The short answer
Yes. The sales, orders, stock and job records you already keep can show which weeks will be busy and where work keeps getting stuck. Start with one decision, tidy the history and test each forecast against a simple baseline, and you run out less, overstock less and stop rebuilding the same planning spreadsheet.
Can predictive analytics help our business plan demand or identify operational patterns in existing data? Yes. The sales, orders, stock, staffing and job records you already keep can show which weeks will be busy and where work keeps getting stuck, provided you start from one decision, tidy the history and check each forecast against a simple baseline.
That usually means fewer empty shelves and less dead stock. Rosters fit busy days better, and someone stops rebuilding the same planning spreadsheet every month. You don't need new data or a data science team to begin. You need the right question and the records that answer it.
Disclosure: Smart AI Solutions wrote this guide and sells the predictive analytics, reporting and operations services linked in it. No other supplier is named or ranked here.
Key takeaways
Owners usually ask the same six questions before they trust a forecast built from their own records.
| Question | Practical answer |
|---|---|
| Where do we start? | Start with one business decision. A forecast can inform stock, staffing or supply plans. Pattern detection shows where activity changes or needs a closer look. |
| Is our data good enough? | Often, after preparation. Consistent definitions, time periods and reporting make it easier to tell real behaviour from data errors. |
| Which method fits? | The method depends on the question. Time-series analysis suits a quantity tracked over time. Regression, classification and clustering answer different questions. |
| How do we know it works? | Test predictions on past periods the model did not use, and keep it only if it beats a simple baseline. |
| What about uncertainty? | Plan around a sensible demand range, not one number, when you weigh stock, staffing and supply. |
| Who acts on a finding? | Give every finding an owner and a follow-up measure. For a warehouse example, see our warehouse operations solutions. |
What your existing data can and cannot tell you
Your own records can warn you about busy periods and unusual changes before they catch the team off guard. Predictive analytics uses patterns in existing data to estimate future outcomes, or to flag records that behave differently from what you would expect. You can use it to plan demand, anticipate customer behaviour and spot operational changes. It does not guarantee what will happen. No model does.
Keep four kinds of analytics apart. Descriptive analytics summarises what happened. Diagnostic analytics investigates why it happened. Predictive analytics estimates what may happen next, and prescriptive analytics compares possible actions.
The distinction matters because a forecast is not a recommendation. Our predictive analytics service supports forecasting and pattern detection, but you still decide what action makes sense for your business.
Demand forecasting estimates a future quantity, such as next month's product sales. Pattern detection finds recurring behaviour or unusual observations, such as a workload peak that keeps coming back or an unexpected drop in completed orders.
A model estimates outcomes from relationships it sees in its inputs. Those relationships are not proof of cause, so read the results alongside business context and human review.

If you want the buying side, our guides to predictive analytics services for operational forecasting and South African predictive analytics consultants cover that. This article stays with the data you already hold.
Get the records you already have ready for demand planning
Good demand planning starts with records your team already trusts, not with a new system. Begin with the decision you want to make and the outcome you need to estimate. Then gather the records that could explain that outcome: dated sales, orders, inventory, staffing, service events, customer activity and operational measures.
Choose a time grain that matches the decision. Daily data may help with short-term replenishment, while weekly or monthly records may suit broader staffing or supply plans. Keep definitions consistent too. Changing what counts as a sale, or mixing different reporting periods, creates patterns that are not really there.
Before a model is trained, look for missing records and duplicates. Outliers and reporting gaps matter too. Skip that and the model learns your data-capture mistakes instead of how the business behaves.
History alone may not explain a shift in conditions. Where it matters, add known drivers such as public holidays, promotions, weather or supplier constraints, so the model can account for influences beyond past demand.

Data preparation and reporting also let you trace each measure back to its source and agree on consistent KPIs. With those in place, you can tell whether a change in the numbers reflects operations or a change in how the data was collected. Our data analytics and reporting service sets up that foundation.
Match the method to the business question
The right method is the simplest one that answers your question well. Choose based on the outcome you need, the inputs you have and the decision the result will support. A more complex model is worth keeping only when it performs better on data it has not seen and improves the decision.
| Business question | Suitable method | What it helps you estimate or find |
|---|---|---|
| How much product might we sell over time? | Time-series analysis | A future quantity, using consistent time intervals to capture trends and seasonal patterns. |
| How might price, promotions or weather affect a numeric outcome? | Regression analysis | A numeric estimate you can compare with observed results to see whether the chosen factors help. |
| Is a customer likely to churn, or will an event fall into a specific category? | Classification | The likelihood that a record belongs to a defined category. |
| Which records behave alike when there are no predefined categories? | Clustering | Groups of records with similar characteristics or activity. |
For product demand based on past demand, time-series forecasting is the natural starting point, because it uses observations recorded at regular intervals. Regression can add context when pricing or promotions may help explain changes.
Classification can also support risk decisions, such as deciding which records need a closer look first. Machine learning can run any of these methods, but the simplest approach that performs well on unseen data is usually the one to keep.
Turn a demand forecast into a plan your team can use
A forecast earns its place only if it changes an order, a roster or a supply plan for the better. First set a simple baseline, such as the most recent period or the same season last year. Compare it with the model on historical periods held back from training. That shows whether predictive analysis adds practical value or only adds complexity.
Measure errors in units the business understands, such as average units missed. Percentage errors need care when actual demand is very low, because a small difference in units can look like a large percentage.
Plan around a sensible range of demand rather than a single estimate. A range lets you weigh the risk of running out against the cost of holding too much, and decide where staffing and supply buffers make sense.
Forecasts become useful when someone owns the decision and knows what to do with the result. Our inventory automation system for retailers, for example, connects to POS systems, supplier systems and sales history to predict demand, automate purchase orders and alert teams before stock runs out.
Forecasts can also support staffing when demand is seasonal or varies by job type. One South African study shows how far existing records can go.
Did you know? University of Johannesburg researchers forecast workforce demand by occupation from the skills-plan records two manufacturing SETAs already collected, using a time-series (ARIMA) model. The forecasts reached at least 80% accuracy for 473 of 713 occupations (66%) in the food and beverage sector and 474 of 522 occupations (91%) in the chemical sector, and accuracy improved where more years of history were available. Source: Maphisa, Nkadimeng and Telukdarie, Big Data and Cognitive Computing, 2024
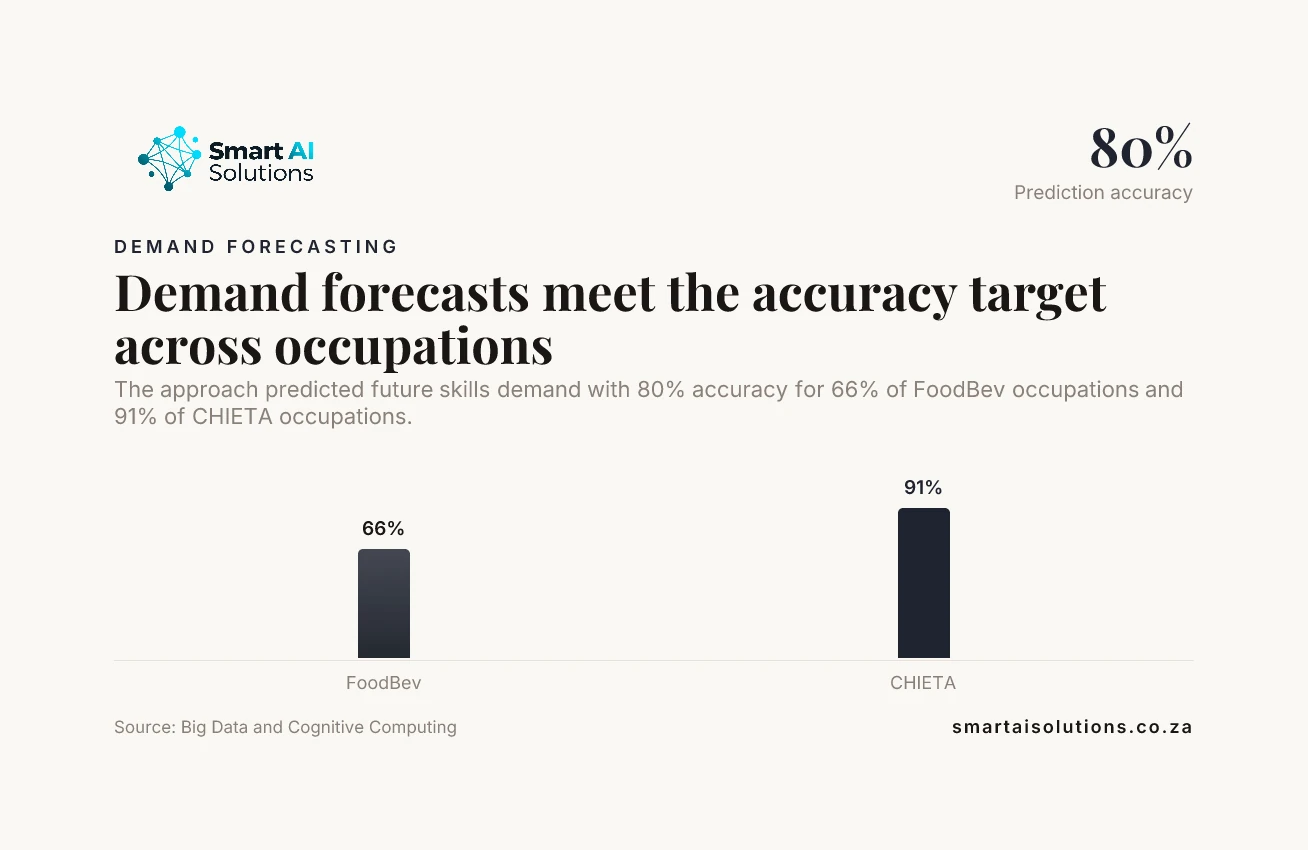
The chart shows the share of occupations forecast with at least 80% accuracy: 66% for FoodBev and 91% for CHIETA.
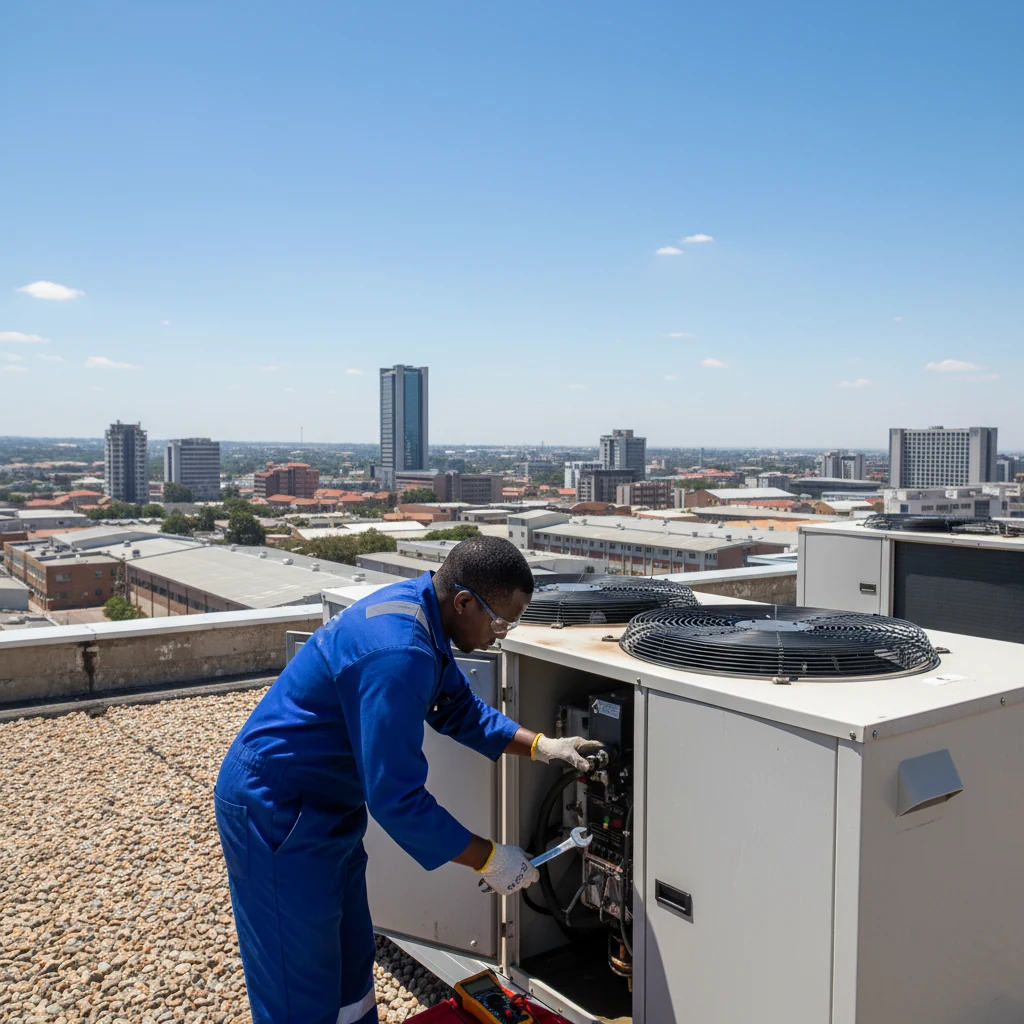
Demand forecasts apply to planning needs beyond stock orders. The two examples below show inventory and seasonal service demand as separate cases: inventory forecasting for dealer groups and seasonal demand planning for HVAC contractors.

Spot operational patterns where work changes
Your records can show where the same bottleneck keeps slowing the team down. To find recurring peaks, bottlenecks or changes in how assets are used, compare activity across comparable periods, locations, shifts or process stages. Like-for-like comparisons make it easier to separate a real pattern from normal differences between teams or conditions.
Treat an unusual spike or drop as a prompt to investigate, not proof of its cause. Anomaly detection can flag the change; the operational context explains it. Check for schedule changes, data issues or equipment events before you choose a response.
For predictive maintenance, patterns in equipment condition or service history show which inspections to do first. Account for changes in equipment, operating conditions and reporting, because those can change what past patterns mean.
Our Operations & Logistics service maps workflows and builds logistics work covering route optimisation, demand forecasting, scheduling and real-time tracking. That operational focus suits questions about how activity shifts between routes and resources, or from one work process to the next.

Connect each finding to a process owner and a follow-up measure, such as waiting time or completion rate. Tracking that measure after a change tells you whether the process actually improved.
Use predictions for customer and inventory decisions
The same records can tell you which customers may drift away and which shelves will run short. Purchase history and customer activity can help estimate outcomes such as a repeat purchase or churn. Link each prediction to a sensible retention or service action, then judge that action by the outcome it is meant to improve.
For store optimisation, Customer Behaviour Analytics provides foot traffic patterns, dwell time analysis and purchase behaviour insights. Those signals add context to customer and store decisions beyond sales totals.
Product- and location-level demand patterns can guide replenishment, but recorded sales do not always equal true demand. Promotions, seasonal shifts and stock availability all affect what customers were able to buy.
Check whether decisions based on predictions improve a relevant outcome, such as fewer stockouts or better retention. A model score on its own does not show that a business decision created value.
Keep forecasts honest: test, monitor and update
A forecast your team can rely on next quarter needs regular checking, not blind faith. Test predictions on data the model did not use for fitting, and compare the results with the baseline. For time-based forecasts, keep the test period after the training period, so that future information cannot leak into the test.
Share the uncertainty and the assumptions behind each prediction. Relationships in historical data shift when customer behaviour, prices, supply or operating conditions change.
After go-live, track forecast errors and the main input patterns. Give a named business owner a regular review slot, so the team can investigate drift before it relies on stale predictions.
Retrain or revise the model when the evidence shows its performance has changed. At the same time, check whether its output still supports the decision you set out to improve.
How we set it up with you
You should not have to learn a new tool to get better plans from the data you already own. We do the setup for you: we connect to your existing records, prepare the history, build the first forecast or pattern check, and stay with you while your team gets used to it.
The worry most owners don't say out loud is that a wrong number will embarrass them, with a customer left waiting or a supplier order that makes no sense. So the rollout moves in three stages, and you control the pace:
- You approve everything. Forecasts, reorder suggestions and pattern alerts are drafted for you, and nothing changes an order or a roster until you approve it. Nothing reaches your customers without your approval.
- Routine work runs on its own, and you stay informed. Once you trust the results, routine updates and alerts run by themselves while you keep seeing what happened and why.
- Hands-off, only when you choose. And some teams never move to this stage. That is fine.
You see a first real result within 48 hours of go-live, and a named person checks in during the first weeks and answers quickly. Our Predictive Analytics service is priced from R35,000 per project, and the scope is set after we have looked at your data.
Frequently asked questions
Owners tend to ask these once they see their own records turned into a forecast.
Can a small business use predictive analytics without a data science team?
Yes. A small business can begin with a clearly defined question and the records it already collects, then use a simple analysis or outside implementation support to build from there.
Does predictive analytics require real-time data?
No. The right refresh schedule depends on how quickly the business needs to respond. Some decisions can use periodic updates, while fast-changing operations may call for more frequent ones.
How should a business handle a prediction that conflicts with managers' experience?
Record the disagreement and the reason for any override, then compare the eventual outcome with both the prediction and the manager's expectation. Those records can reveal missing context and improve future decisions.
Can predictive analytics work when the business has only a small number of past examples?
It can, but a small sample may not represent rare events or the full range of business conditions. Keep decisions proportionate to the evidence, and consider scenario analysis or relevant external information when the history is short.
Can predictive analytics help manage business risk?
Yes. A model can help prioritise cases for review, such as customers or transactions with patterns linked to a risk outcome. The business then applies its established policies to decide how to respond.
What type of data analytics identifies patterns, and what does predictive analytics aim to do?
Descriptive analytics finds patterns in past results. Predictive analytics uses those patterns to forecast likely outcomes or flag unusual records, turning historical records into estimates that guide a decision, such as what to plan for or where to investigate a change.
Conclusion
Can predictive analytics help our business plan demand or identify operational patterns in existing data? Yes. It gives you fewer stock surprises, rosters that fit the work and earlier warning when something changes, as long as you match the method to the question, prepare consistent records, test forecasts against a baseline and connect every useful output to a clear decision.
Treat predictions as evidence for planning, not as guarantees or automatic instructions. Start with one problem: a demand forecast for the product line or service that most often runs short or overbooks, set up through our predictive analytics service. Once that is working, add pattern alerts for the bottlenecks that slow your team down with our Operations & Logistics service. To talk through which records you already have, contact us.